Scientific measurement TokEye
Find the structure hiding in a noisy signal.
A tool for extracting coherent and transient features from fluctuating time series—turning a crowded spectrogram into something a researcher can measure.
ContributionLead author · signal extraction & scientific software
Project record2025–2026 · preprint & open-source software
A measurement problem before a modeling problem
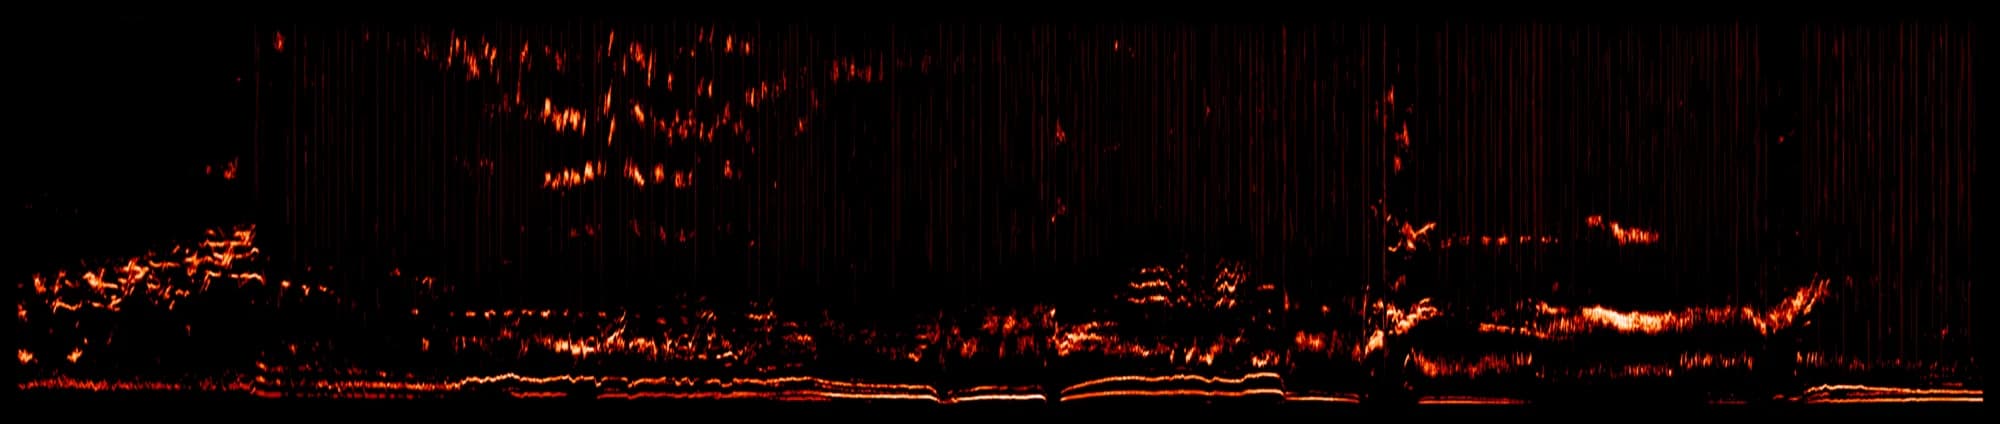
An experiment can record more data than a person can inspect. In a spectrogram, narrow bands may drift, bursts may overlap, and background noise may obscure both. Before asking what the system will do next, we need to identify what happened and when.
TokEye approaches this as scientific measurement. Its job is to locate structure in fluctuating signals so that the next stage of analysis has something concrete to work with.
Do the expensive work offline
The method uses an offline signal-processing procedure to provide self-supervised learning targets. A neural network learns a fast approximation of that procedure, separating coherent features from transient ones in the time–frequency plane.
This separates the cost of preparing the learning target from the cost of processing a new observation. The paper evaluates the approach on fusion diagnostics from DIII-D and TJ-II, alongside signals outside fusion.
From a picture to an analysis pipeline
You can start with a one-dimensional signal or an existing spectrogram. The Python interface returns two score maps, one for coherent structure and one for transients. The command-line interface also saves masks and visual previews for batch processing.
The extracted features are a starting point for measurement. Interpreting a feature as a particular physical phenomenon still requires diagnostic context and independent checks. A clear shape in a spectrogram is evidence to investigate, not a physical explanation by itself.
Run the app on your computer
With uv installed, run this in a terminal. The app opens locally; choose Load Example Signal to begin. The model downloads on first use.
uvx 'tokeye[app]' appInstallation options & Python API
Papers & resources
Read the TokEye paper
Method, experiments, and evaluation · arXiv, 2026
Code & installation guide
Python API, command line, and local web app